Sharper skills using Microsoft Excel for business
When I tell people about our business and the courses we provide most people say that they would love to improve their skills in Excel. A lot of you have probably stared at an empty spreadsheet and just wished that it would magically turn into a great looking report with clever analysis. There are numerous books on how to learn Excel, but very few people actually take the time to read them. The courses that are available are normally many hours long and go through every detail – something many business professionals today are too busy for. Today I’m very pleased to announce that our course, “Sharper skills using Microsoft Excel 2010 for business” has gone live on Udemy. Instead of walking through the features of Excel I will show you how to effectively use Microsoft Excel 2010 in real life business scenarios in just over one hour. If you take the course you will learn the following
1. Viewing data
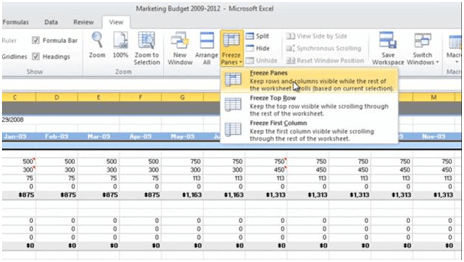
In the first lecture, you will learn how to effectively navigate spreadsheets. If you have a large spreadsheet with thousands of rows it can really help to use keyboard shortcuts to get to the end of your spreadsheet, instead of using your mouse to scroll through all the data. You will also learn how to freeze rows and columns and how to arrange spreadsheets side by side so that you can easier compare numbers.
You will learn how to hide and unhide rows and columns and how to quickly find all the hidden cells in a spreadsheet.
2. Analyzing data
Microsoft Excel is an extremely powerful application with many advanced tools for analyzing data. In the first part of the “Analyzing Data” lecture, you will learn how to sort and filter data. Many times you can find the answers you are looking for by just knowing how to properly sort and filter your data. Here you will learn how to sort a dataset by multiple columns and how to sort data in an order that you define yourself such as “High Priority”, “Medium Priority” and “Low Priority”.
Even though it might seem paradoxical, sometimes you want to sort your data randomly. Say for instance that you want to randomly pick one hundred customers for a customer survey. In this lecture, you will learn how you can use the RAND function to sort your data totally randomly.
In addition to sorting data, you commonly use filters to find data that meets certain criteria. In this lecture, you will learn how to filter data based on different criteria such as “containing a certain word”, or the “top 10 items” and so on. You will also learn how to use search box filters and how to filter on color.
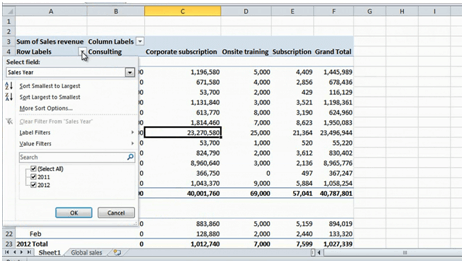
Quite often you need to analyze data by quickly adding numbers. A very powerful tool for analyzing data is the PivotTable in Excel. Using a PivotTable you can instantly see the sum of a range of numbers and you can easily move data around to see it from different perspectives. In the second part of the “Analyzing data” lecture, you will learn how to create PivotTables and how to change the settings to show exactly what you want to see.
3. Visualizing data
Many times you need to share your analysis with other people and in that case, it’s great if you structure the data into a report and format it in a way that’s easy for others to understand. In the “Visualizing data” lecture you will learn how to create informative and great looking reports in Microsoft Excel 2010. You will learn how to add colors to your reports, how to add filter buttons, so-called “slicers” and how to spice up your charts so that they really look attractive.
4. Cleaning and modifying data
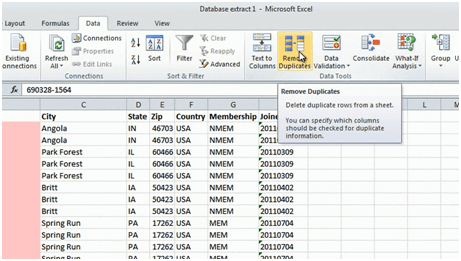
From time to time you are given a data file that you need to clean up in order to make some sense of it. The data might have been extracted from a database in which case it isn’t very user-friendly to read. If you’re working with large sets of data you don’t want to waste your time by manually going through a large set of rows and columns. In the first part of the “Cleaning and modifying data” lecture you will learn how to clean up your data by switching rows into columns, deleting and moving columns and spotting and deleting duplicates.
In the second part of the lecture, you will learn how to modify your data by splitting and combining columns, censoring data and to clean up data containing empty spaces or other unwanted characters.
5. Calculating numbers
In the final lecture, you will learn how to use Microsoft Excel 2010 to do calculations. You will learn how to use functions and formulas and how to quickly fill your spreadsheet with numbers. You will learn how to use relative and absolute references and how to copy formulas across cells.
In the last part of the lecture, you will learn how to use some of the many lookup formulas built into Microsoft Excel. Lookup formulas are commonly used to calculate a number based on certain criteria, for instance, if the performance of the employee was “5” than the bonus should be $10,000, if it was “4” the bonus should be $8,000.
Something for everyone
Even if you are an experienced Excel user I’m sure that you will find a number of new useful tips that will help you through your day. Investing a little over an hour of your time to learn how to use Excel more effectively for business is definitely time well spent. You will save time and hopefully be able to be more creative when it comes to analyzing and reporting your numbers.
(If you have difficulties reading this article, you can access the full article in pdf here)


