Quick ways to communicate organizational structures
Learn how to create org charts in PowerPoint and Visio 2010
Introduction
Welcome to Business Productivity, I’m Ulrika Hedlund. In this video I’ll show you how you can create attractive looking organization charts to quickly and easily communicate what your organizational structure looks like.
It is extremely important for people within an organization to know who does what in order to promote cross group collaboration. Many times this information is also very valuable for you partners and your customers, so that they can know who to deal with.
Time and time again I see people spend numerous of hours drawing shapes and reporting lines themselves by hand, when there are tools that automatically do this for you.
So let me show you the tools in Office that can easily help professional looking org charts in just a few minutes!
Quickly convert text into an org chart (00:53)
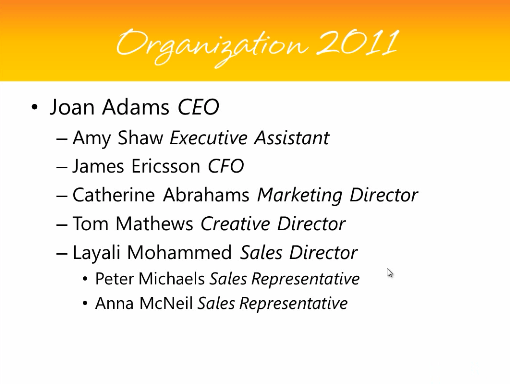
So let’s see how instead of using text in a PowerPoint slide like this:
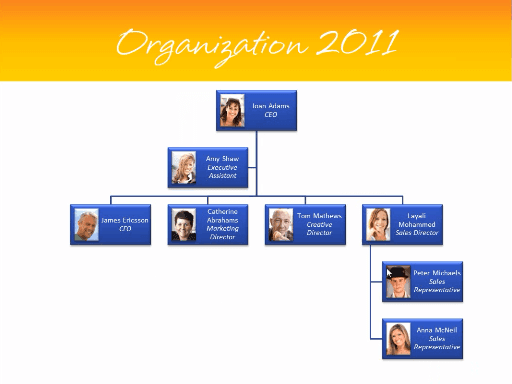
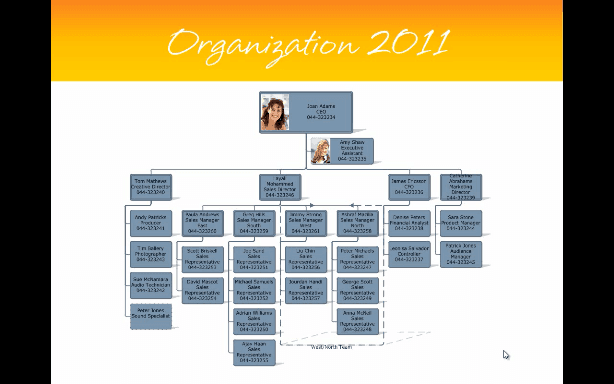
we can use SmartArt and convert it to an organization chart that looks like this:
As you can see, this is much easier to digest and right away I get a good overview of the organizational structure. Personally, I recommend that you have pictures of the people in your organization it really helps to communicate your message.
So to get started I simply mark the text, and click “Convert to SmartArt”.
I’ll go into the “Hierarchy” group and choose the one with pictures.
This is a good starting point, however I need to work a little bit more with this graphic before it’s done.
Re-arranging the org chart (01:40)
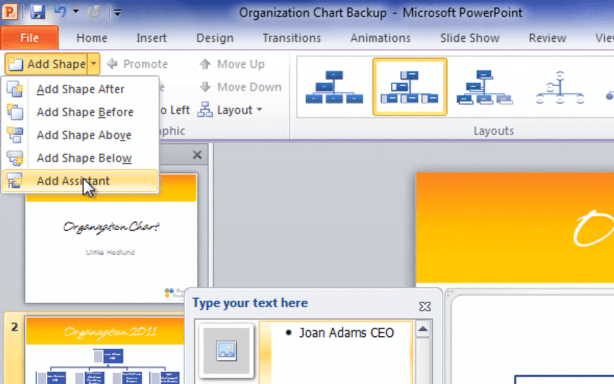
Before I add the pictures I want to rearrange the org chart a little bit. For instance I want to move Amy Shaw, the Executive Assistant, so that she is right below the CEO. So do to this I’ll just cut the information about Amy, I’ll mark Joan Adams, and I’ll “Add shape”, which is an “Assistant shape”, and I’ll just paste in the information again.
By marking an area of the org chart you can change the layout. I can choose to have it “Left Hanging”, or if I want them both on the same level I chose “Standard”. But in this case I’ll go back to the original which was “Right Hanging”.
Adding pictures (02:26)
Now the structure is the way that I want it, now I can go in and I can add the pictures. To do this I just click on the image button, and insert the picture. Now I’ll do the same thing for all of the other pictures. If you don’t have profile pictures of the employees within your organization you can ask your employees if they have profile pictures on Facebook or LinkedIn that you can use.
There I’m almost done!
Add a design (02:55)
To finish it off I just want to add a nice design, so I go to the “SmartArt Tools Design” and go to the gallery and chose a nice finishing. And there we go!
If you have a larger organization you might need more advanced tools then the ones available in PowerPoint, in that case you can use Visio. Visio 2010 has the new user interface, so even if you aren’t used to working in Visio you’ll find it a lot easier to use. Let’s have a look.
Part 2
Introducing Visio 2010 for more advanced org charts (00:23)
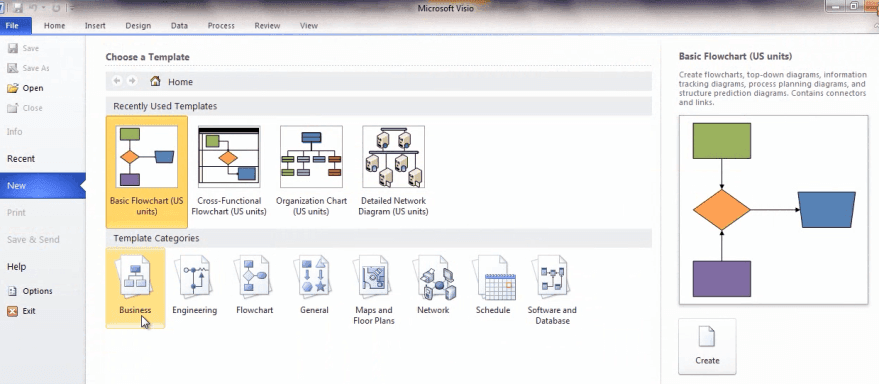
When you open up Visio you’re prompted with a number of different templates. The organizational chart templates are located in the Business category.
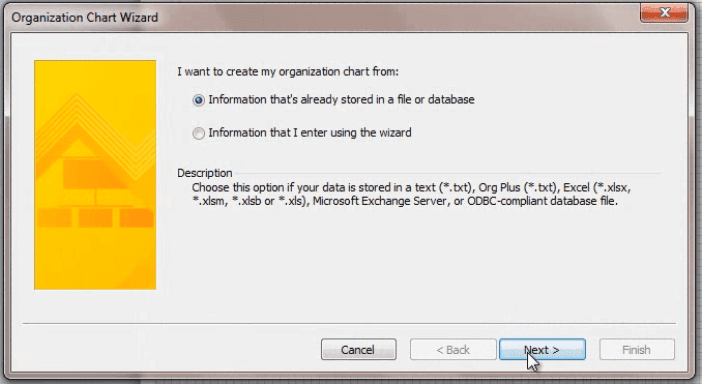
There are two different templates to choose from, the “Organization chart” which allows you to start from scratch, or the “Organization Chart Wizard”. This wizard helps you connect data that you have in another data source, such as in an Excel file or in a database, to your org chart.
Connecting the org chart to data in an Excel file (00:50)
In this case I already have a lot of the information about the organizational structure in my Excel file, so I’m going to use this file to connect to the org chart. I’ll select the [Org] Chart Wizard and leave the default options selected since I’m using an Excel file.
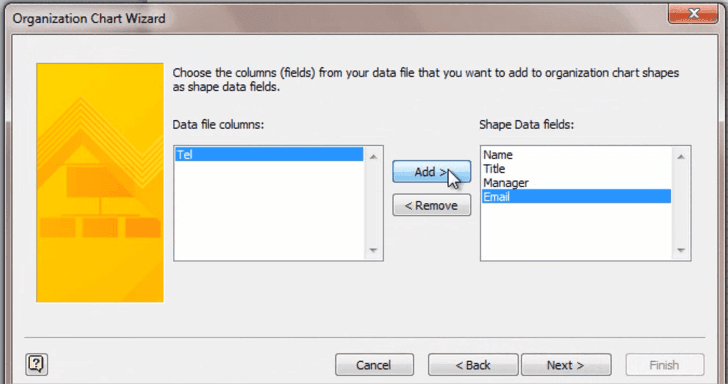
I’ll browse for the Excel file and select it. It’s important that the Excel file is closed when you choose this option because otherwise it won’t be able to read from the file. Here I have to map the columns of my Excel file into fields that Visio understands.
I select the fields that should be visible in the org chart and I also select the fields that I want to have in the Vision chart as properties. This means that they can be available to view, such as the email or the telephone number if I choose to show these in the org chart.
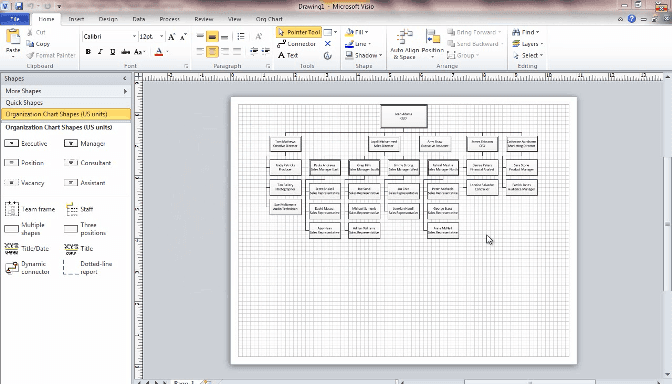
And here you go:
Now we can start working with the org chart in Visio. Let me just zoom in a little bit.
Showing employee information in the org chart (01:57)
As you can see the shapes only have the name and the title. However, all of the information that we had in our Excel file is stored in the shape itself, so we have the telephone number and the email. If I want to display this information in the shape, I click “Display Options”, “Fields” and the one I want, for instance telephone.
Visio will automatically rearrange the layout so that all of the information is visible in the org chart.
Re-arranging the org chart (02:28)
Now I want to change the position of the Executive Assistant Amy Shaw. I mark the shape and then I click the “Change Position Type” and I change it into an “Assistant”. Click “OK”, and then “Re-layout”. This way the org chart updates with the new structure.
It’s very easy to move things around in Visio. I can drag and drop shapes onto new managers and the chart updates. I can also insert a new position, just drop it on top of the manager, in this case a new “Vacant” position.
Adding pictures (03:10)
Just like we did before in PowerPoint I can also add pictures. “Insert picture” and just select the one that you want. I’ll do the same for Amy, “Insert”.
When I’m done with all my changes I click “Re-layout” and the chart updates for me. If the chart gets too cluttered I can choose a manager and choose “Hide Subordinates”, this way I have a better overview of the org chart.
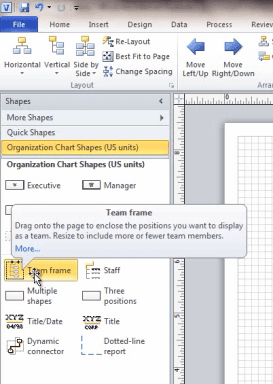
There are numerous tools that I can use in Visio, for instance I can use the “Team Frame” if I want to show a virtual team, and I can just click the title.
Exporting data to Excel (04:01)
I can export the org chart back into Excel. However this will only export the data, not the pictures.
Adding a design (04:10)
When I’m done with the org chart I want to add a nice design. So I click the “Design” tab, and I’ll choose a nice design from the gallery. I can also apply an effect.
Now if there are any changes in the organizational structure you have to do the changes here. If you try to import data from the Excel file again you will lose all of the pictures that you put. So I would recommend that you use this Visio file to keep track of your updates. To do that you can just double-click and write the new name and title, or you can right-click and you’ll come to the “Properties” and here you can write in the new information.
Presenting your Visio Org Chart in PowerPoint (05:02)
If you want to use this org chart in your PowerPoint presentation you can just “Copy” and “Paste” it. And there you have it, a quick and powerful way of communicating your organizational structure.
Closing
Now that you’ve watched these two videos I hope you will never waste your valuable time by manually drawing organizational charts. Let the tools do the job for you so that you can focus your time on adding more value to your business. I’m Ulrika Hedlund for Business Productivity. Thanks for watching!


