How to insert sparklines in Excel 2010
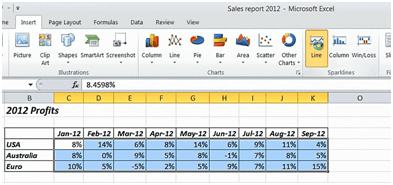
To add Sparklines, mark the data range you want to chart, click “Insert” and then under the “Sparklines” section select the chart type you want.
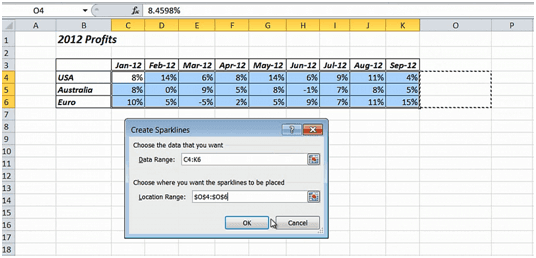
Here I’ll select the line chart. Define where you want the Sparklines to be added and I’ll just mark the cells in the column next to my table.
There, now I can clearly see that our profits for the US are declining, they are fluctuating for Australia and increasing for the Euro region.


