How to add animations to graphs in PowerPoint 2010
Please note that this is a shortened, fast-speed video with the objective to give you a glimpse of ways in which you can improve your business productivity. The full video: “Captivate your audience with motion” shows you how to perform the steps in a slower, more user-friendly fashion.
You can also access the full course, “Eye-catching presentations using Microsoft PowerPoint 2010” on Udemy.
Learn how to to add animations to graphs in Microsoft PowerPoint 2010
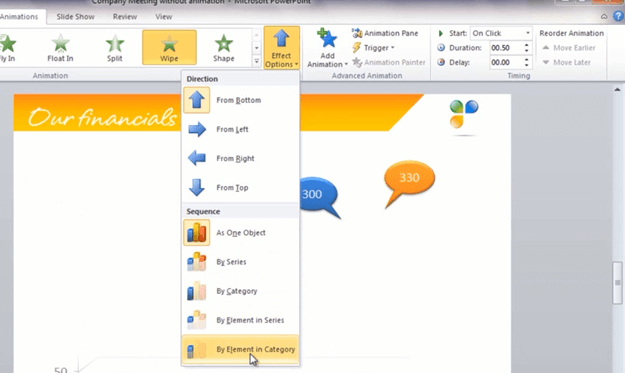
Here I have a slide with financial results; I want to add a little bit of suspension to my presentation by adding some animation to this graph.
To do that I’ll mark the graph, and I click the “Wipe” animation, under “Effect Options” I can select how I want the graph to be animated and in this case I want each element in the different categories to appear one by one.

Now let’s have a look at the final result. As I click through the slide the bars appear one by one and then finally the totals. This is a great way to present financial data.


