
Highlights of Excel 2013
Excel 2013 is filled with a number of new innovative tools that can help you save a lot of time. Instead of using formulas to modify data just show Excel what you want to do and FlashFill will do the rest for you.
FlashFill understands various patterns and learns from what you are doing. If Excel doesn’t completely understand what you want to do, keep filling in more cells and Excel will figure out the pattern.
With FlashFill you don’t have to waste time trying to figure out how to use difficult formulas, just show Excel what you want and FlashFill will take care of it for you!
To help you better analyze data, you can mark your data and click on the Quick Analysis lens. Excel suggests a number of ways to format your data. You can select between a number of formatting options to find numbers that stand out, you can visualize your data through charts, and see various totals, tables and sparklines. You get a live preview of all recommended views so that you can see what the result will look like before you decide.

Highlights of Excel 2013
With the new Excel anyone can create spreadsheets with insightful charts. Excel 2013 will analyze your data and recommend charts that provide the best possible insight. You get a live preview of what your data will look like before you decide on a chart. Depending on your data, Excel will recommend different charts to show off your data in the best possible way. When you have inserted one of the recommended charts you can make modifications to the chart by clicking one of the three buttons that now appear next to your chart. Here you can select among various design options to make your chart look really attractive. You also have various options to modify how you want the information to be displayed in your chart.

Highlights of Excel 2013
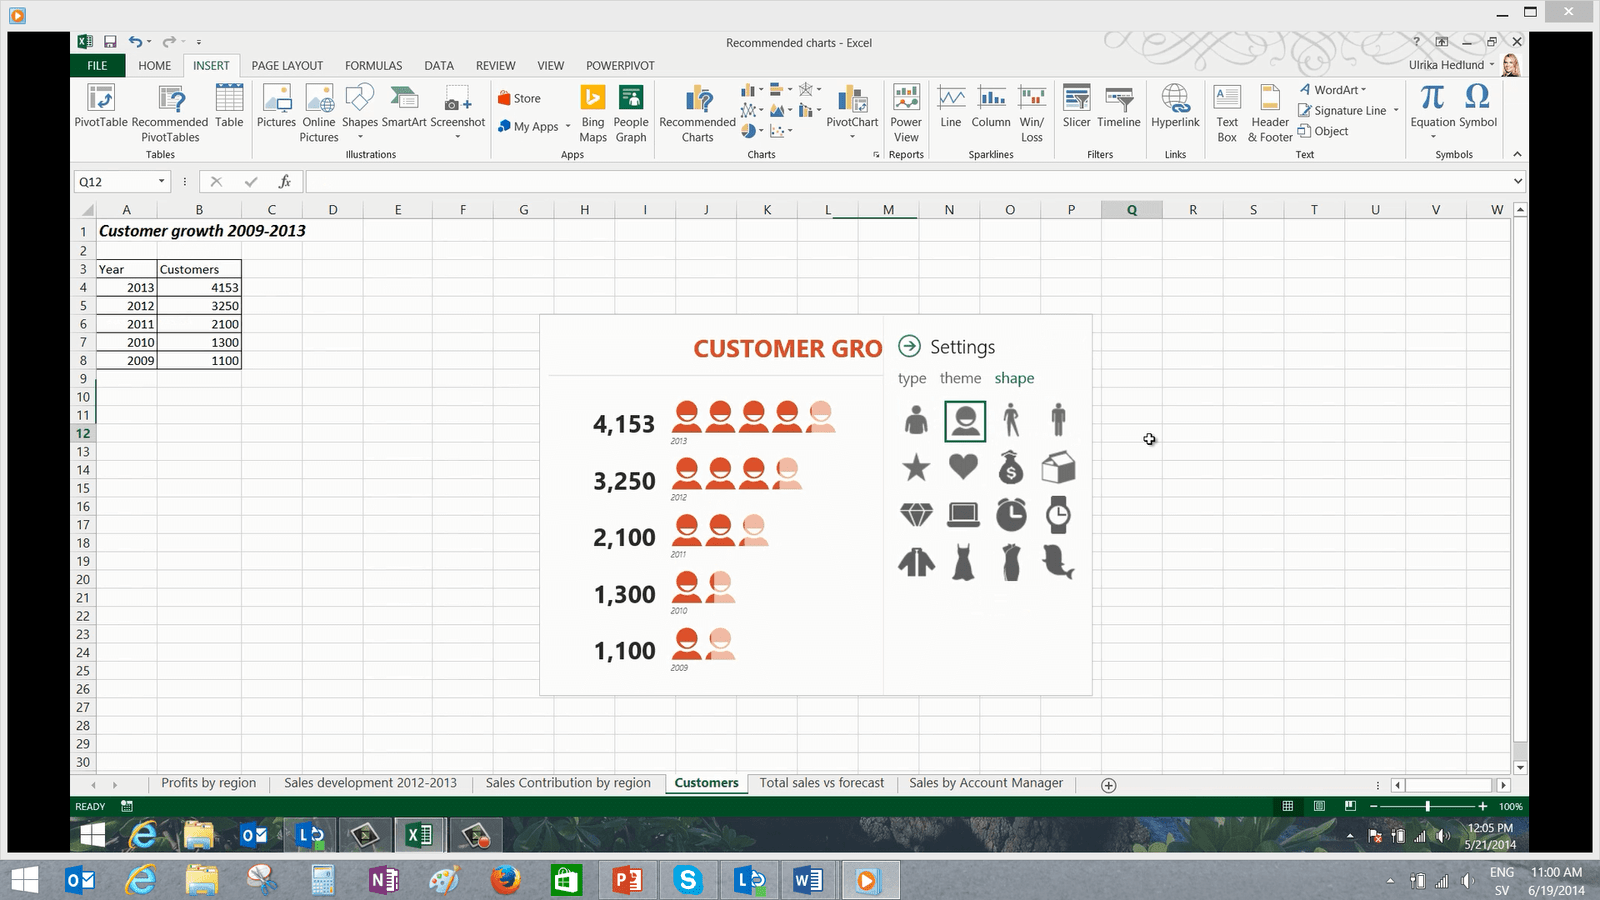
You can extend the charting functionality further by inserting an app into your spreadsheet from the Office store. The People Graph is a fun way to present data. Give your graph a name and then select the data you want to chart. You can select between numerous themes and shapes, whatever is most appropriate to represent your data.
Highlights of Excel 2013
Advanced users that use Excel for complex data analysis will be very pleased with the new data modelling and visualization capabilities built into Excel.
You can now import millions of rows of data into Excel, you can use PowerPivot to create and manage data models right from within Excel. Your data can reside in Excel or in an external data base or data service. Using PowerPivot you have advanced tools for data calculations and data relationships.

Highlights of Excel 2013
With “POWER VIEW” you can create attractive reports and dashboards to make your data look really amazing!
Once you start using Excel 2013 you will never want to go back!