Find answers by sorting and filtering data
Learn how to sort and filter data in Excel 2010
Introduction (00:05)
Welcome to Business Productivity – I’m Ulrika Hedlund.
Many times you have a large spreadsheet with data that you need to make sense of. The spreadsheet might contain sales data and you want to find the top deals, or it might contain human resource data and you want to find employees within a specific salary range, or inventory data and you want to find products below a certain stock level.
In this video I’ll show you how you can sort and filter using Excel 2010 in order to find answers to specific questions. We’ll have a look at sales opportunity data and we’ll look at the top 10 opportunities, we’ll look at our top account managers, we’ll also have a look at deals that are about to close within a specific date range and then we’ll look for interesting issues that are hidden in the large amount of data. Let’s get started!
Viewing your spreadsheet (01:00)
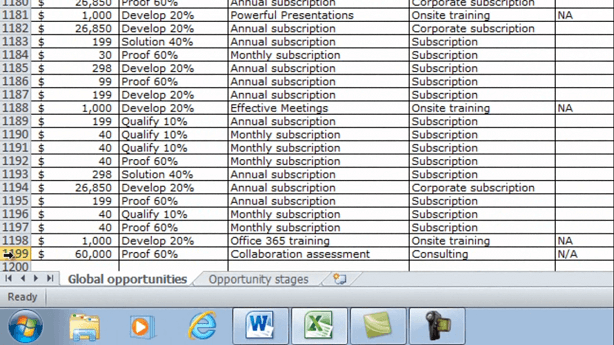
Here I have sales opportunity data exported from our customer relationship system. As you can see I have quite a lot of opportunities here. To see exactly how many opportunities I have I’ll click CTRL + End, to go to the last cell, and here I can see that I have 1199 rows in this excel sheet, to go back I’ll just click CTRL + Home.
Now I’d like to know how large our biggest deals are in terms of product revenue, so I want to sort this list based on product revenue. To do that, I’ll just mark any cell in the product revenue column, click Data and then click on the Sort button, which is [Sort] Largest to Smallest.
Immediately, by just sorting on the product revenue column I get a much better understanding of this opportunity pipeline. I can see that I have three large opportunities in the range of 8-10 million, I have a number between 200 000 and 800 000, and then the rest are below 100 000, so the majority of this pipeline is for smaller deals.
Sorting multiple columns after one another (02:08)
Now I’d like to know how many opportunities each account manager has and what type of opportunities these are, so I want to sort on two columns. In order to do that; click the Sort dialog box.
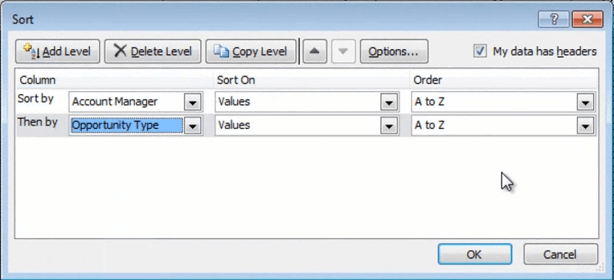
Here you get the option to add multiple levels, so we’ll start with the Account Manager column and sort this A to Z. Then we’ll add one more level and then sort by Opportunity Type and again we’ll do this A to Z.
In Excel 2010 you can add 64 levels to sort by, so I think that should be enough for most scenarios. And then I’ll just click OK. So now I can see that our account manager Abdullah has three Consulting opportunities, the majority corporate subscription and then just one normal subscription opportunity.
Sorting in an order you define yourself (03:00)
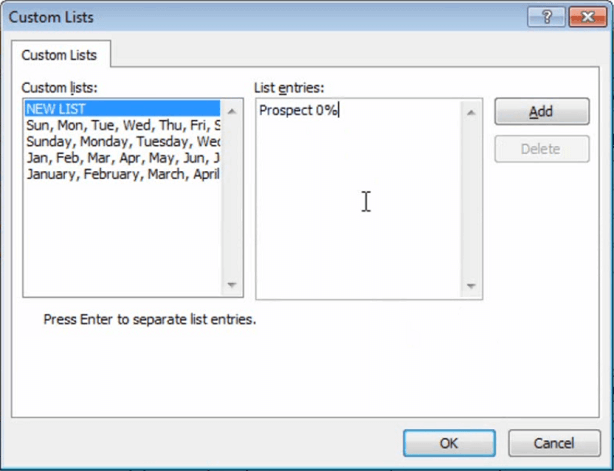
Now this is very useful information, but in addition to that I’d like to sort by Sales Stage. I can’t sort this column alphabetically, because then I’ll get them in the wrong order, I’d like to sort them in this order: starting with Prospect 0%, to Close at 80%.There are two different ways in which I can do this. First I’ll show you the manual way. Go back to the Sort dialog box, and add one more level. Here we’ll select the Sales Stage and instead of sorting A to Z, we’ll select Custom List.
Here Excel has a number of custom lists built in, so for instance you can sort by month, by day of the week, etc. we’ll click NEW LIST and click Add. So here I’ll start with Prospect 0%.
I’ll add all of the list entries and then click OK. But instead of doing this manually I want to import the into Excel’s already defined custom lists. So to do that we’ll click the File tab, Options.Go to Advanced options, scroll all the way down until we see Edit Custom Lists.
Here we’re going to select our list and then click Import.
As you can see, the list has now been added to the custom list of Excel. Then I’ll just click OK, and OK. We’ll click our Sort dialog box again and we’ll add a new level. We’ll select our Sales stage and select Custom Lists, and here we have our list, and we’ll just click OK. Now you can see that each opportunity type has been sorted by sales stage.
Sort on color (04:42)
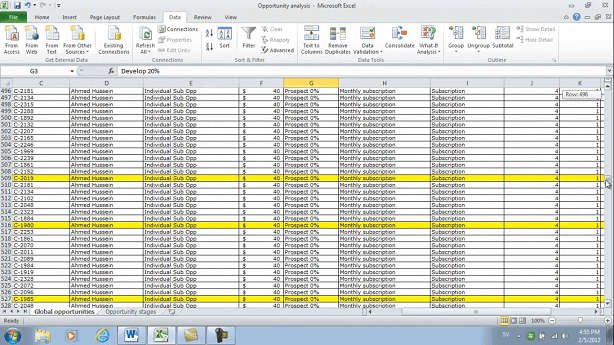
Now in addition to sorting on the values of the sales themselves, sometimes you want to sort on the formatting, such as the color. If I scroll down here you can see that I have a number of rows that have been highlighted.
So now I’d like to sort on color. To do that, I’ll click my Sort dialog box again and I’ll just delete these levels. I’ll add a new level, and here I can select any columns, since they’re all colored. Here I’ll select cell color. If I click here I’ll see all the colors available in my spreadsheet.
And I’ll start with the yellow, and then I’ll add a new level where I’ll add the green. And then click OK. Now I have all of the opportunities that have been highlighted in yellow on the top and then the ones that have been colored green. I can quickly see that the ones that have been highlighted in green have been closed in just four days, where the ones that have been highlighted in yellow are still on the prospect stage, even though they’re over 200 days old, so their account managers definitely need to follow up on these opportunities.
Sorting randomly (05:52)
Now even though it might sound like a contradiction sometimes you want to sort data randomly. Say for instance that I randomly want to pick 10 opportunities to follow up on. Excel has a function for randomly generating numbers so what we’ll do we’ll use this function to sort our data. I’ll click in a new cell and then I’ll go to the Formulas tab, I’ll go to the Math book and then scroll down to the function that’s called RAND, for random.
And then click OK.
Now I want a number to be generated for all of my rows, so I’ll just double-click in the corner to copy this formula across my spreadsheet.
Now I can use this column to sort. So I’ll go to my Data tab and then sort. And now we can pick the top 10 opportunities and these will be totally random.
Filtering (06:44)
Another great way to find answers to specific questions is to use filters. You might want to see your top 10% of the opportunities from the revenue perspective or you want to filter your data so that you’re only looking at the opportunities that are closing this month. To add filters to your data just mark the first row with your headers and click the Filter button.
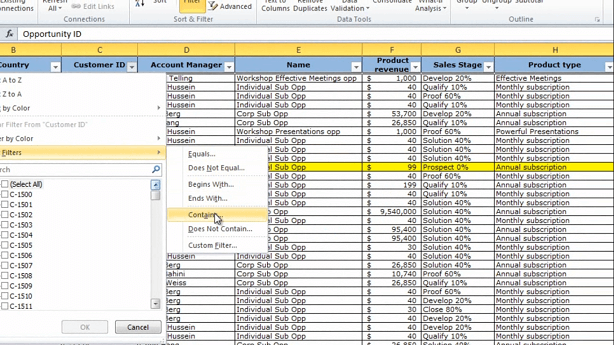
As you can see you get a little arrow next to each column name and here you get the filter options. You can resize the filter box by just pulling the handle. And here you can see all of the options. I can deselect all by clicking Select All.
And then I can select the values I want to filter on. Excel also recognized different types of data in your column and gives you different filters. Since this is a text field I get Text Filters.
The text filters enable me to filter on fields containing specific characters. So for instance I can select “Contains” Customer-ID with the number “1610”, or containing “2398” and click “OK”,
and here you can see all the opportunities related to those customers. To clear the filter I’ll just click “Clear”.
Another very powerful way to filter is by using the search field. So here I can just type “1610” and click “Enter” and again I get all of the opportunities related to that customer. To clear the filter I can click “Clear” up here [Sort & Filter section on the Ribbon] or “Clear Filter From Customer ID”.
If I go to the product revenue filter, you can see that I here have Number Filters so here I want to look at our top 10% deals from a product revenue perspective. I’ll click Top 10.
But instead of Items, I’ll select Percent and click OK. And here they are: my top 10% deals. Again I’ll click Clear to clear the filter.
Finally let’s have a look at a date filter, so if I look at the due date for these opportunities I get date filters from excel. So here I can easily filter on different date fields. So for instance I only want to see the opportunities that have a due date this month. So I’ll just click This Month, and you can see we get all of the opportunities that are due in February.
Closing (09:13)
Learning how to sort and filter data is the first basic step in order to make sense of large amounts of data. Excel offers even more powerful tools to analyze data, but more on that in another video. I’m Ulrika Hedlund for Business Productivity – Thanks for watching!


