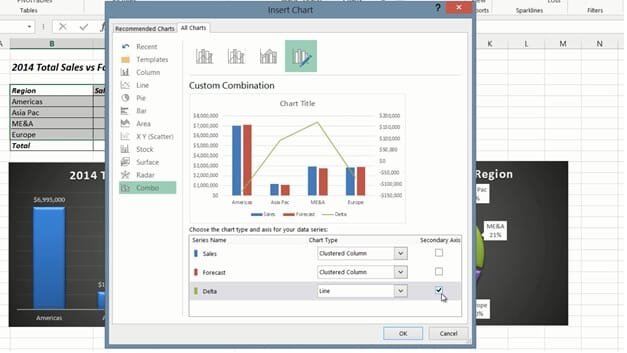
How to insert a combo chart
To insert a combo chart, mark the data you want to include in the chart. Here I’ll select the Sales, the Forecast and the difference between the two (Delta). On the “INSERT” tab, click “Recommended charts”, click the second tab called “All Charts” and click “Combo” at the very end. Here you can select from a number of predefined combo charts. I’ll select this column/line chart. If your data series has different scales, select the option to insert a “Secondary Axis”. I’ll add a secondary to the data series with the deltas. To insert the chart click OK.
Now you have a combo chart that clearly shows multiple data series in one. I’ll apply a nice design and update the title.


